
Today, I will be conducting an analysis of leveraged ETFs with the goal of providing information to retail investors who may not be well-versed in this subject. In particular, we will be focusing on filling the gap in information regarding the long-term performance and expenses of leveraged ETFs.
Welcome to my blog, where I aim to bring attention to overlooked subjects and shed light on important issues that may not always receive the attention they deserve. Our focus will be on stock write-ups, documentaries, and quantitative analyses, as they offer valuable insights and perspectives that can help us better understand the world around us. These subjects have the power to educate, inspire, and stimulate critical thinking.
Long term, indices go up. So why not leverage this and achieve higher returns? Why is the standard 0% leverage? We will try to answer this.
Let us first introduce leveraged ETFs. In 2022, inflows for leveraged ETF have doubled compared to 2021. Now representing 5% of all ETF purchases. The most common leveraged ETF is a daily rebalanced etf which use total return swaps to amplify or invert returns. For example, the S&P 500 ETF (SPY) rising 5 %, the 2x SPY ETF would rise approximately 10 %. Portraying the fact that over a given time period, 2x ETF does not imply 2x returns: Here, the returns alternate 4 times between +10% and -10%.
| SPY | 2x SPY |
|---|---|
| 1.1 | 1.2 |
| 0.99 | 0.96 |
| 1.09 | 1.15 |
| 0.98 | 0.92 |
In this simplified example, we have omitted management fees and interest expenses. Management fees are usually higher due for leveraged ETFs, around 0.75 % anually. Any online sources on leveraged etfs dont dive into interest expenses, while I theorize in this article that this is the most import denominator for out/under-performance.
Perfect world
We will return to SPY later, but now consider the MSCI all world index. Since this data set was freely accesible from 1999. Suppose we live in a perfect world, without management fees and interest expenses. MSCI going up 10% implies 2x MSCI going up 20%. But the downside is also doubled. Would we have outperformed the index historically?
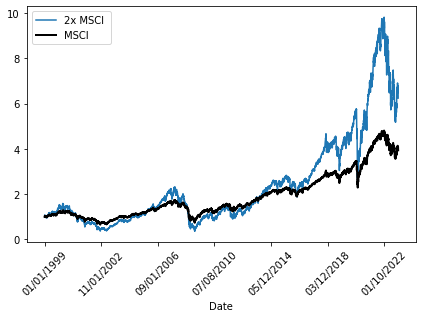
We notice great outperformance in this perfect world against the index over the last 23 years. But inspecting the graph, we have periods of underperformance and the large outperformance is in periods where the market is continually moving up.
Interest and management expenses
Let us now compute the leveraged return under different levels of interest + management expense. From 1-7 %. And see at what level of interest rate + management expense (r) we still outperform the unlevered index:
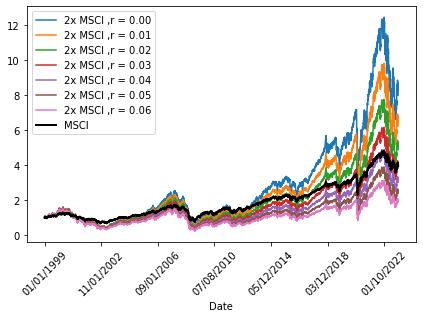
In the above plot, we see that with r > 0.04, we dont outperform anymore! Since we have double the downside, we should want adequate return as compensation. Perhaps only r < 0.02 is sufficient outperformance? We will now proceed to do something which has received little to no public attention, and maybe for more nefarious reasons. Can we find out what r is in a real levered index?
Reverse engineering r
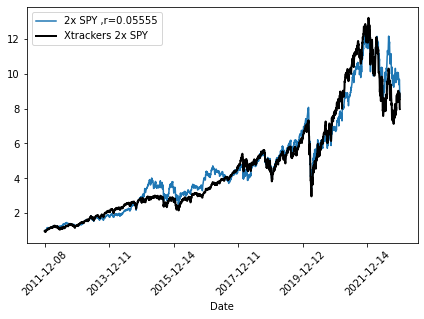
Let us proceed with something novel. We will return to the SPY index from 2010, and also retrieve data from 2010 of 2x leveraged SPY etf: “Xtrackers S&P 500 2x Leveraged Daily Swap UCITS ETF 1C”. Our method of retrieving r (interest + management expense) will be as follows:
- Calculate investment of 1 from 2010-2022 for theoretical 2x SPY and the Xtrackers 2x SPY etf.
- Set up discounting process of 2x SPY with (1+r)^(-1/251) (annualized r to daily r) for each time step
- Minimize Mean Absolute Deviation (MAD) between 2x SPY and Xtrackers 2x SPY by varying r
We keep in mind that this is an approximate solution, since the real r varies with time. Minimizing this we get that the MAD is minimized for r = 0.055. Which implies interest + management expenses of 5.5 % , removing average managment expense yields average interest expense of 0.055-0.0075 = 0.0475 %
To display goodness of fit we show two graphs:
(out)performance ?
Let us now return to the longer data set of the MSCI etf. Using r = 5.5 % in this, we achieve the following graph:
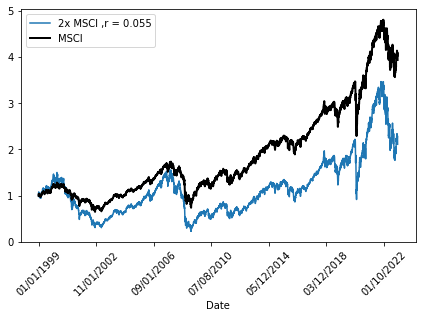
One possible explanation is that negative returns carry more weight through simple mathematical arguments: A stock that falls by 50% must subsequently rise by 100% to balance itself out. The disadvantage here is reinforced not only by the leverage factor, but also by the costs. Again, simplified: a rise of 10% would mean a rise of 20% - cost, and a fall of 10% would mean a fall of 20% - cost. Which is greater in absolute terms than the leveraged net increase.
My aim of this post was to comprehensively dissect the black box of leveraged ETFs, since I was unable to find this information myself on the web. With these statistics in mind, I hope retail investors dont hold these ETFs for the longer term. It wouldnt be surprising if they do, since the information is so sparsely available and the thesis can look deceivingly simple. As with most investment decisions, its complicated.